Flat Tire
Minimum Votes to Win the Electoral College
With a Republican once again winning the electoral college despite losing the popular vote, I was wondering, what, mathematically, is the fewest number of ballots needed to win the electoral college?
My first approach was to rank the states in order of votes per electoral vote, and assign the states with the fewest ballots per EV to one candidate until that candidate has enough electoral votes to win.
I found an interesting source of data in the United States Elections Project: They have already tallied in one spreadsheet not just the population of each state or the number of registered voters, but the projected actual number of ballots counted, including outstanding provisional / mail-in ballots. Since the goal is to compare electoral votes to popular vote outcomes, the number of votes cast by state seems the most relevant data to answer the original question. So, I used their estimated 2016 November General Election Turnout data, retrieved the morning of November 12th.
I put those in a spreadsheet which contains the number of electoral votes by state, added a calcualted column Ballots per EV = Ballots / Electoral Votes, sorted by Ballots per EV in ascending order, and marked the first 32 states as belonging to the electoral vote winner.
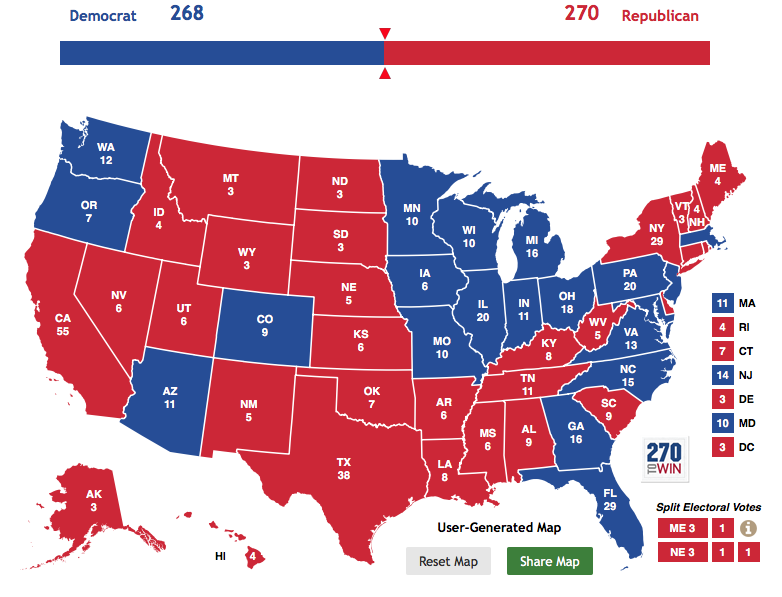
In the winner's states (marked as Republican [red] in the map below), I assigned the winner 50.01% of the vote, and the loser the remainder. In the rest of the states, I assigned the winner 0% of the vote, and the loser 100% of the vote. This of course is an impossible outcome in real life, but this is math, not real life!
This resulted in 30 million votes going to the electoral college winner out of 133 million votes cast: The winner won with only 22.5% of the votes.

Maps generated at 270 To Win.
Given that the intent is to produce the most electoral votes from the fewest total votes, I found it interesting that this scenario included in the winner's column many larger states that are typically thought of as underrepresented, including 3 of the 5 most populous states: California, Texas, and New York. But that intuition is based on a measure of population per electoral vote. The many factors that prevent residents from becoming voters - citizenship status, age, and voter enthusiasm to bother voting - reduce the total number of ballots cast in these states by more than most, and moved the voters in these states to in fact be slightly over-represented in the critical metric of ballots per electoral vote. I imagine enthusiasm is significantly driven by partisan makeup of the state. Florida, a swing state, gives voters far more reason to believe their vote might tip the national election, and has far more political operatives dragging voters to the polls.
But I also noticed that this solution produced a winner wih 284 electoral votes - a non-trivial amount more than the fewest electoral votes required to win. That New York was the tipping point state demonstrated that it might be necessary to un-select one state before adding the next state. I wanted to know if we could do better.
This seemed like a textbook case where the optimal solution needs to be found from among all possible ways to reach the current state, not just the most obvious one. So I whipped up a knapsack-style dynamic programming solution. For each number of electoral votes, it computers from each fewer number of electoral votes (including zero) which state, if any, can most efficiently reach the curent number of electoral votes. That is:
For EV_count in 1 to 538
    Mark ev_count as having no solution
    For subproblem in 0 to EV_count - 1
        ev_gap  = EV_count - subproblem
        possible_states = states with ev_gap votes not in solution(subproblem)
        best_state = state in possible_states with fewest ballots per electoral vote
        If ballots(solution(subproblem) + best_state) < ballots(solution(ev_count))
            let solution(ev_count) = solution(subproblem) + best_state
Again assigning 50.01% of the winner's states' votes to the winner, and 100% of the loser's states' vote to the loser, the solution this found required about 2.5 million votes fewer to win: 27.5 million out of 133 million cast, or 20.7% of the total ballots cast. It did this by substituting the 22 electoral votes of Arizona and Indiana with Louisiana's 8 electoral votes, creating a solution with exactly 270 electoral votes. While an impossible scenario in any political reality (let alone the one we exist in), it is impressive just how unrepresentative of public preference the electoral college could get.

Map generated at 270 To Win.
Is it inevitable that the best winning solution would have exactly 270 votes? Perhaps not. I also printed out the minimum ballots to reach every other electoral vote total, and there were in fact three non-trivial such totals that required fewer ballots than the optimal solution for one fewer electoral vote (at 489, 498, and 508 electoral votes).
For this exercise, I broke out the states who assign electoral votes based on congressional district into separate "states" for the at-large and congressional-district based electoral votes by dividing the at-large ballots in half and assigning the other half of those ballots to the congressional-district based 'states' proportionally to the number of votes cast in those districts. I did not attempt to prevent any 'silly' cases such as an at-large winner who did not win any congressional districts, but fortunately the optimal solution did not require me to do so.
A list of the states assigned to the winner:
- Alabama
- Alaska
- Arkansas
- California
- Connecticut
- Delaware
- District of Columbia
- Hawaii
- Idaho
- Kansas
- Kentucky
- Louisiana
- Maine (At-Large and Congressional District-based)
- Mississippi
- Montana
- Nebraska (At-Large and Congressional District-based)
- Nevada
- New Hampshire
- New Mexico
- New York
- North Dakota
- Oklahoma
- Rhode Island
- South Carolina
- South Dakota
- Tennessee
- Texas
- Utah
- Vermont
- West Virginia
- Wyoming
Resources:
- evpack.pl, a knapsack implementation of the problem in Perl. No, it's not especially elegant code.
- states.txt, state data I used, in tab-delimited format
- MinVote.numbers, a spreadsheet used for the first pass, with vote assignments modified for the results of the second pass.
First Violet
Another three men on a boat quote
There is something very strange and unaccountable about a tow-line. You roll it up with as much patience and care as you would take to fold up a new pair of trousers, and five minutes afterwards, when you pick it up, it is one ghastly, soul-revolting tangle.
Just another installment of "some things never change": How many jokes in sitcoms have emerged from this phenomenon observed with earbud cords, now that everyone carries them around to use with their cellphones?
Latest Galleries
Go Read This
- 100 Years of California WildfiresAdventures in Mapping
- The Truth is Paywalled but the Lies are FreeCurrent Affairs
- Roll-Up MonopoliesBIG
- Billionaires' TollboothsBIG
- "Immune Amnesia" and the importance of the measles vaccineRespectful Insolance
- Periodic Table - design and alternativesJunkCharts
- Computing FreedomInessential (via DaringFireball)
- Why I (Still) Love Tech: In Defense of a Difficult IndustryWired
- How instantaneous communication sabotages deep workTaxProf Blog
More of My Stuff:
Others' pages
Really Cool Weather Links
- California Snowpack Summary
- Daily Plot of California Snowpack
- SD River - Projected Height
- SD River - Most Recent Measurement
- California Observations
(loads Rain by default)
 RSS Feeds
Random Quote:
"Facts are meaningless. You could use facts to prove anything that's even remotely true." -Homer Simpson
Add a Quote


